What Factors Affect SAT Scores?
We will be investigating the effects of income, crime, ethnicity, wi-fi availability, and noise complaints on the SAT Scores in New York City.
A higher SAT score for a school normally means a higher graduation rate for the school students, which is pretty evident from the from the graph showcased below. But what factors are involved in ensuring a high SAT score or even a low SAT score for that matter? This is exactly what we are going to try and answer in the following few sections of this project.
Heat Map Showing Distribution of SAT Scores in NYC
Income Level
Does income affect SAT Scores in New York City?
One of the factors that we wanted to look at, which could possibly affect the SAT score results of the New York schools was the mean income level of the house holds. One of the reasons behind it was having a higher mean income means access to more facilities such as private coaching, private schools etc and we wanted to know whether there was any correlation between the income and the SAT results.
We plotted the mean income of the different school districts along with their mean SAT scores and as you can see there is a small positive correlation between the two factors. As a result, income and SAT scores are somewhat related to each other, even though they might not have a strong correlation.
Heat Map Showing Distribution of Income in NYC
Ethnicity
Do areas having a single dominant ethnicity affect SAT Scores in New York City?
Does belonging to a different ethnicity actually have an advantage or is it just a misconception? In order to tackle that, we will compare the distribution of the 4 ethnicities: asian, black, hispanic and white in the 10 different score intervals.
Click a different box within the legend to the right to specify data of certain ethnicity. Then, check the "sort values" box to sort by bucket size. Click the box again to exit and return to the default view.
Hispanic Distribution
White Distribution
Black Distribution
Asian Distribution
Noise Complaints
Does a high number of parties and noise complaints in an area affect SAT Scores in New York City?
Borough
Total Noise Complaints
Noise Complaints per Square Mile
A story to tell
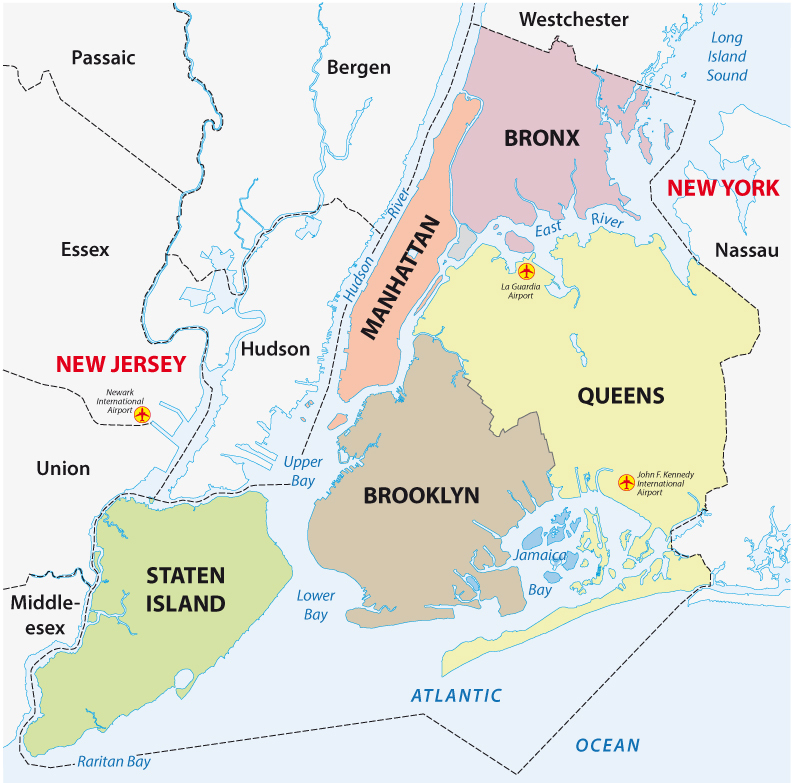
Here we have a visualization of the total noise complaints in each New York City borough from the year 2014-2015. How might noise complaints affect SAT scores of high schools in each bourough? What happens when we factor in noise complaints per square mile?
We reveal the true, more relative circle sizes based off the noise complaint density.
Note how the circle sizes change once square mileage is factored into the picture.
How might the level of noise complaints correlate with crime, income, and even WiFi?

Wi-Fi Hotspots
Does the prevalence of Wi-Fi hotspots affect SAT Scores in New York City?
Borough
Total Wifi Hotspot Locations
Wifi Hotspots per Square Mile
The story goes on
Now we have a visualization of the total wifi hotspots in each New York City borough from the year 2014-2015. How might wifi hotspot presence affect SAT scores of high schools in each bourough? What happens when we factor in the number of hotspots per square mile?
We reveal the true, more relative circle sizes based off the wifi hotspot density.
Note how the circle sizes change once square mileage is factored into the picture.
How might the density of wifi hotspots correlate with crime, income, and even noise complaints?

Select a feature to underlay as a density map below.
Click on a school district on the map below to display its overall SAT stats, or go ahead and select a specific school on the map to the right for school-specific SAT stats.
Average Score (SAT Math)
Average Score (SAT Reading)
Average Score (SAT Writing)